The week after an activation has a familiar shape. The agency asks the photo vendor for the assets, the registration vendor for the list, and the game vendor for the scores. Three exports arrive in three formats. Somebody spends two days in a spreadsheet trying to figure out whether the 2,100 photo sessions and the 1,400 registrations are the same people, and the client gets a deck with a lot of pictures and one number nobody fully trusts.
We built our dashboard to end that week. Every kiosk, game, and registration point we run reports to one place, against one guest profile. Here is what the client sees the next morning, and why each number is there.
1. Sessions versus unique guests
Sessions are how busy the footprint was. Unique guests are how many people you actually reached. Both matter, and they are different numbers. A registration-first flow, or an RFID band issued at the door, is what makes the second number honest, because the same person playing the Pop-A-Shot four times is one guest, not four.
2. Opt-ins, by consent type
Marketing opt-in, terms acceptance, age gate, sweepstakes entry, each tracked separately with the exact language the guest saw. This is the number regulated brands care about most, and it is the reason the consent screen is configured per program rather than reused.
3. Outputs delivered, and how
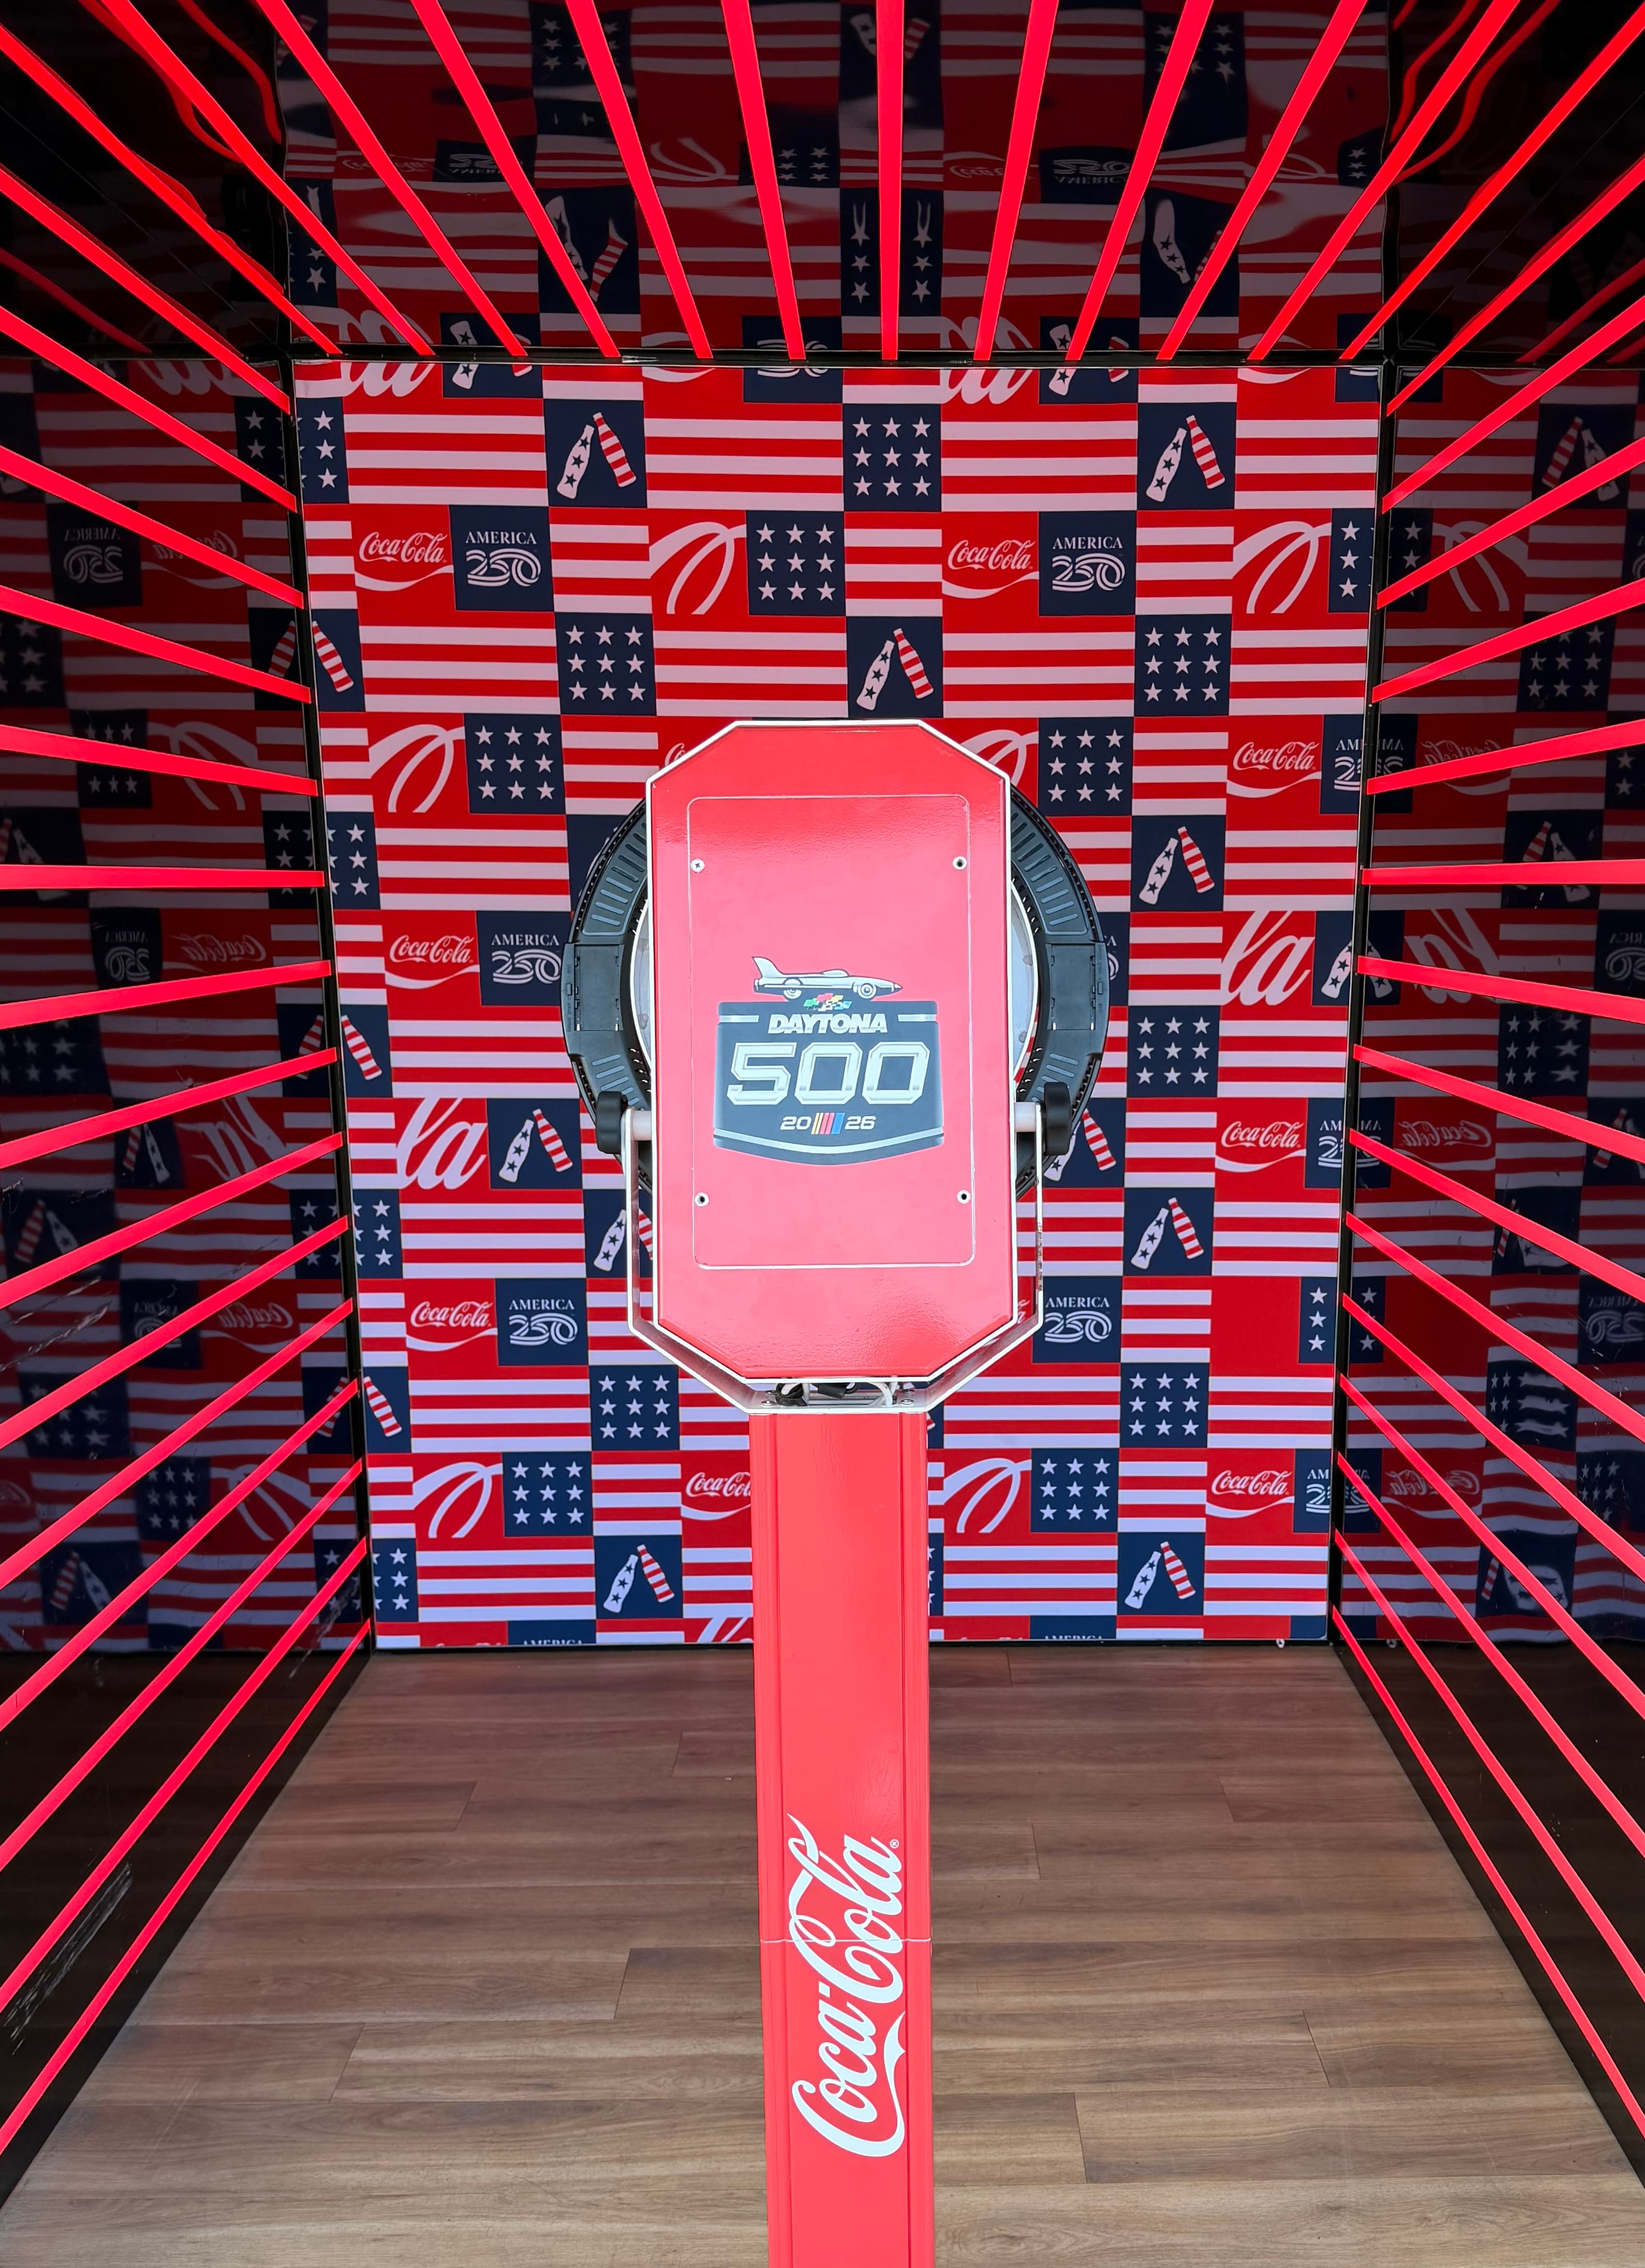
Photos, videos, GIFs, AI cards, prints. Delivered by text, by email, by QR pickup, or on paper. At the Coca-Cola Daytona 500 program the delivery mix across photo, boomerang, and GIF told the client which format guests actually wanted, which changed the creative for the next race.
4. Shares by channel
How many delivered outputs were opened, and how many were shared onward from the share page. This is the closest thing to earned reach a live activation produces, and it is measurable only if the share page is yours.
5. Plays, scores, and repeat rate
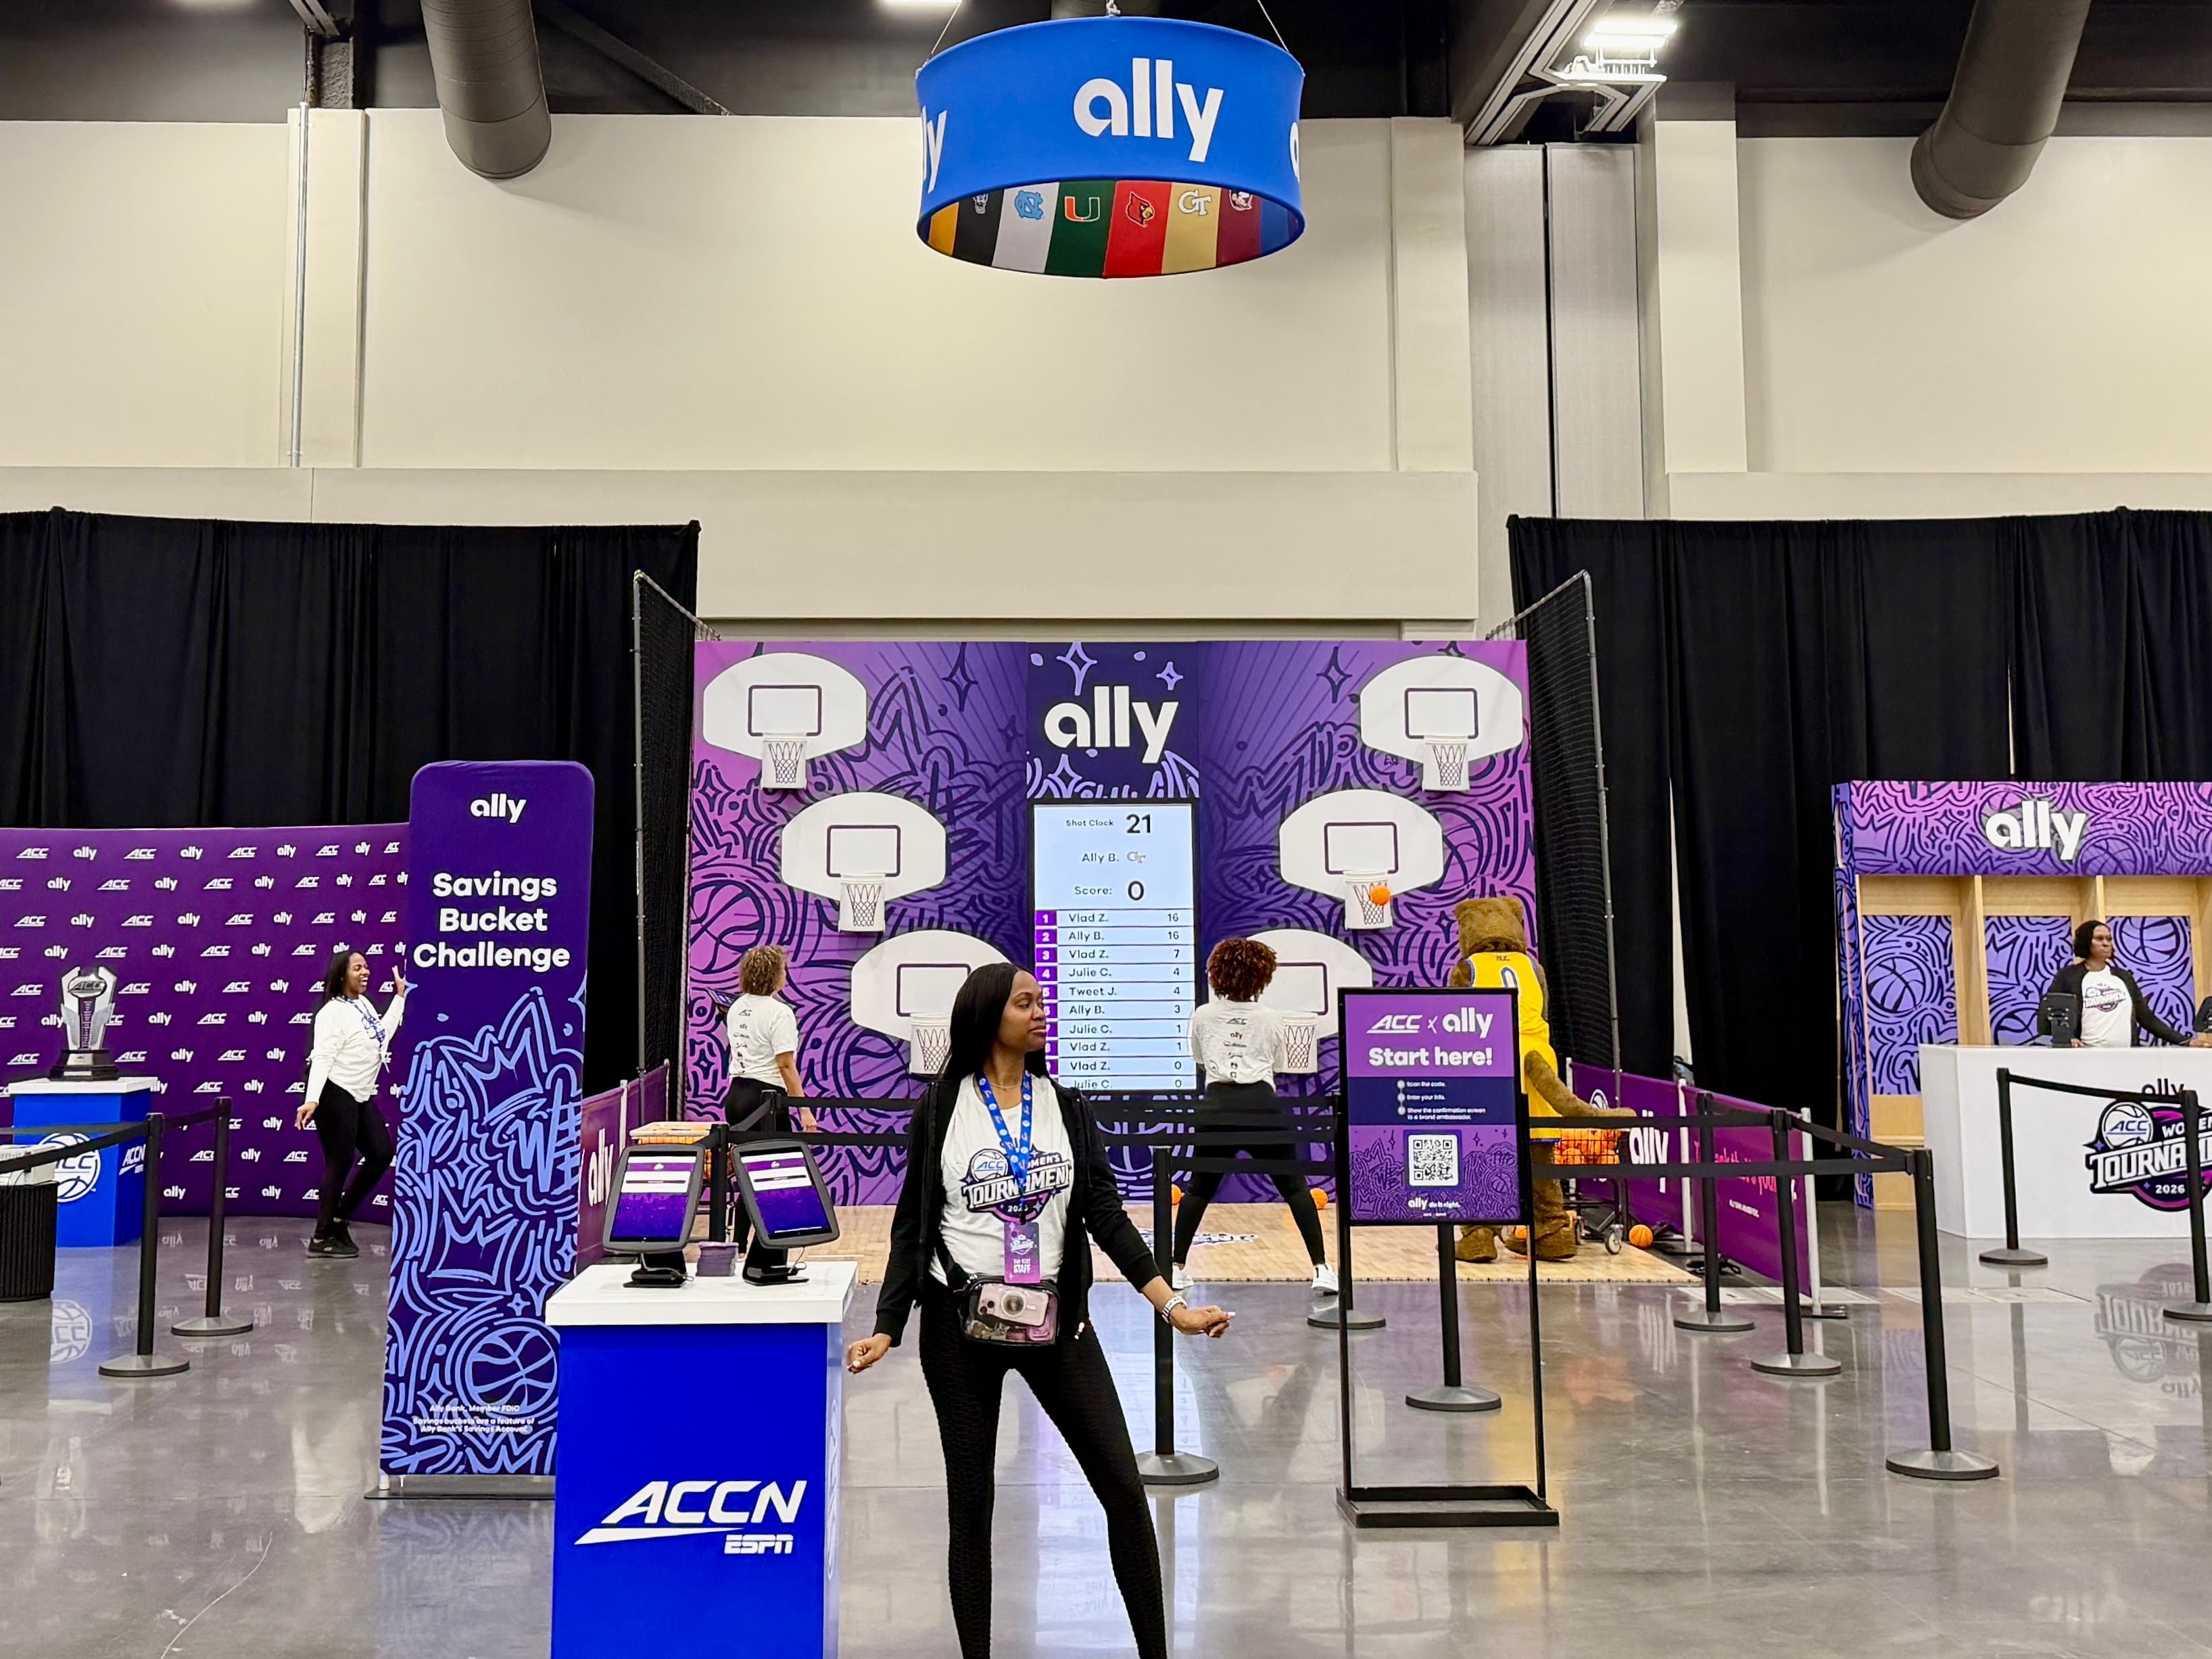
For games: total plays, plays per unique guest, and the leaderboard. A high repeat rate is the signal that the game worked; a leaderboard nobody climbed is the signal that the prize window was wrong. At the ACC Women's Tournament, 793 gameplay sessions on the Ally Pop-A-Shot came with a repeat rate that justified the sensor build.
6. Dwell and throughput by hour
When the line formed, when it cleared, and how long a session took. This is the operational number. It tells the producer whether to add a unit next time and tells the client when their footprint mattered relative to the event schedule.
7. The export the CRM can ingest
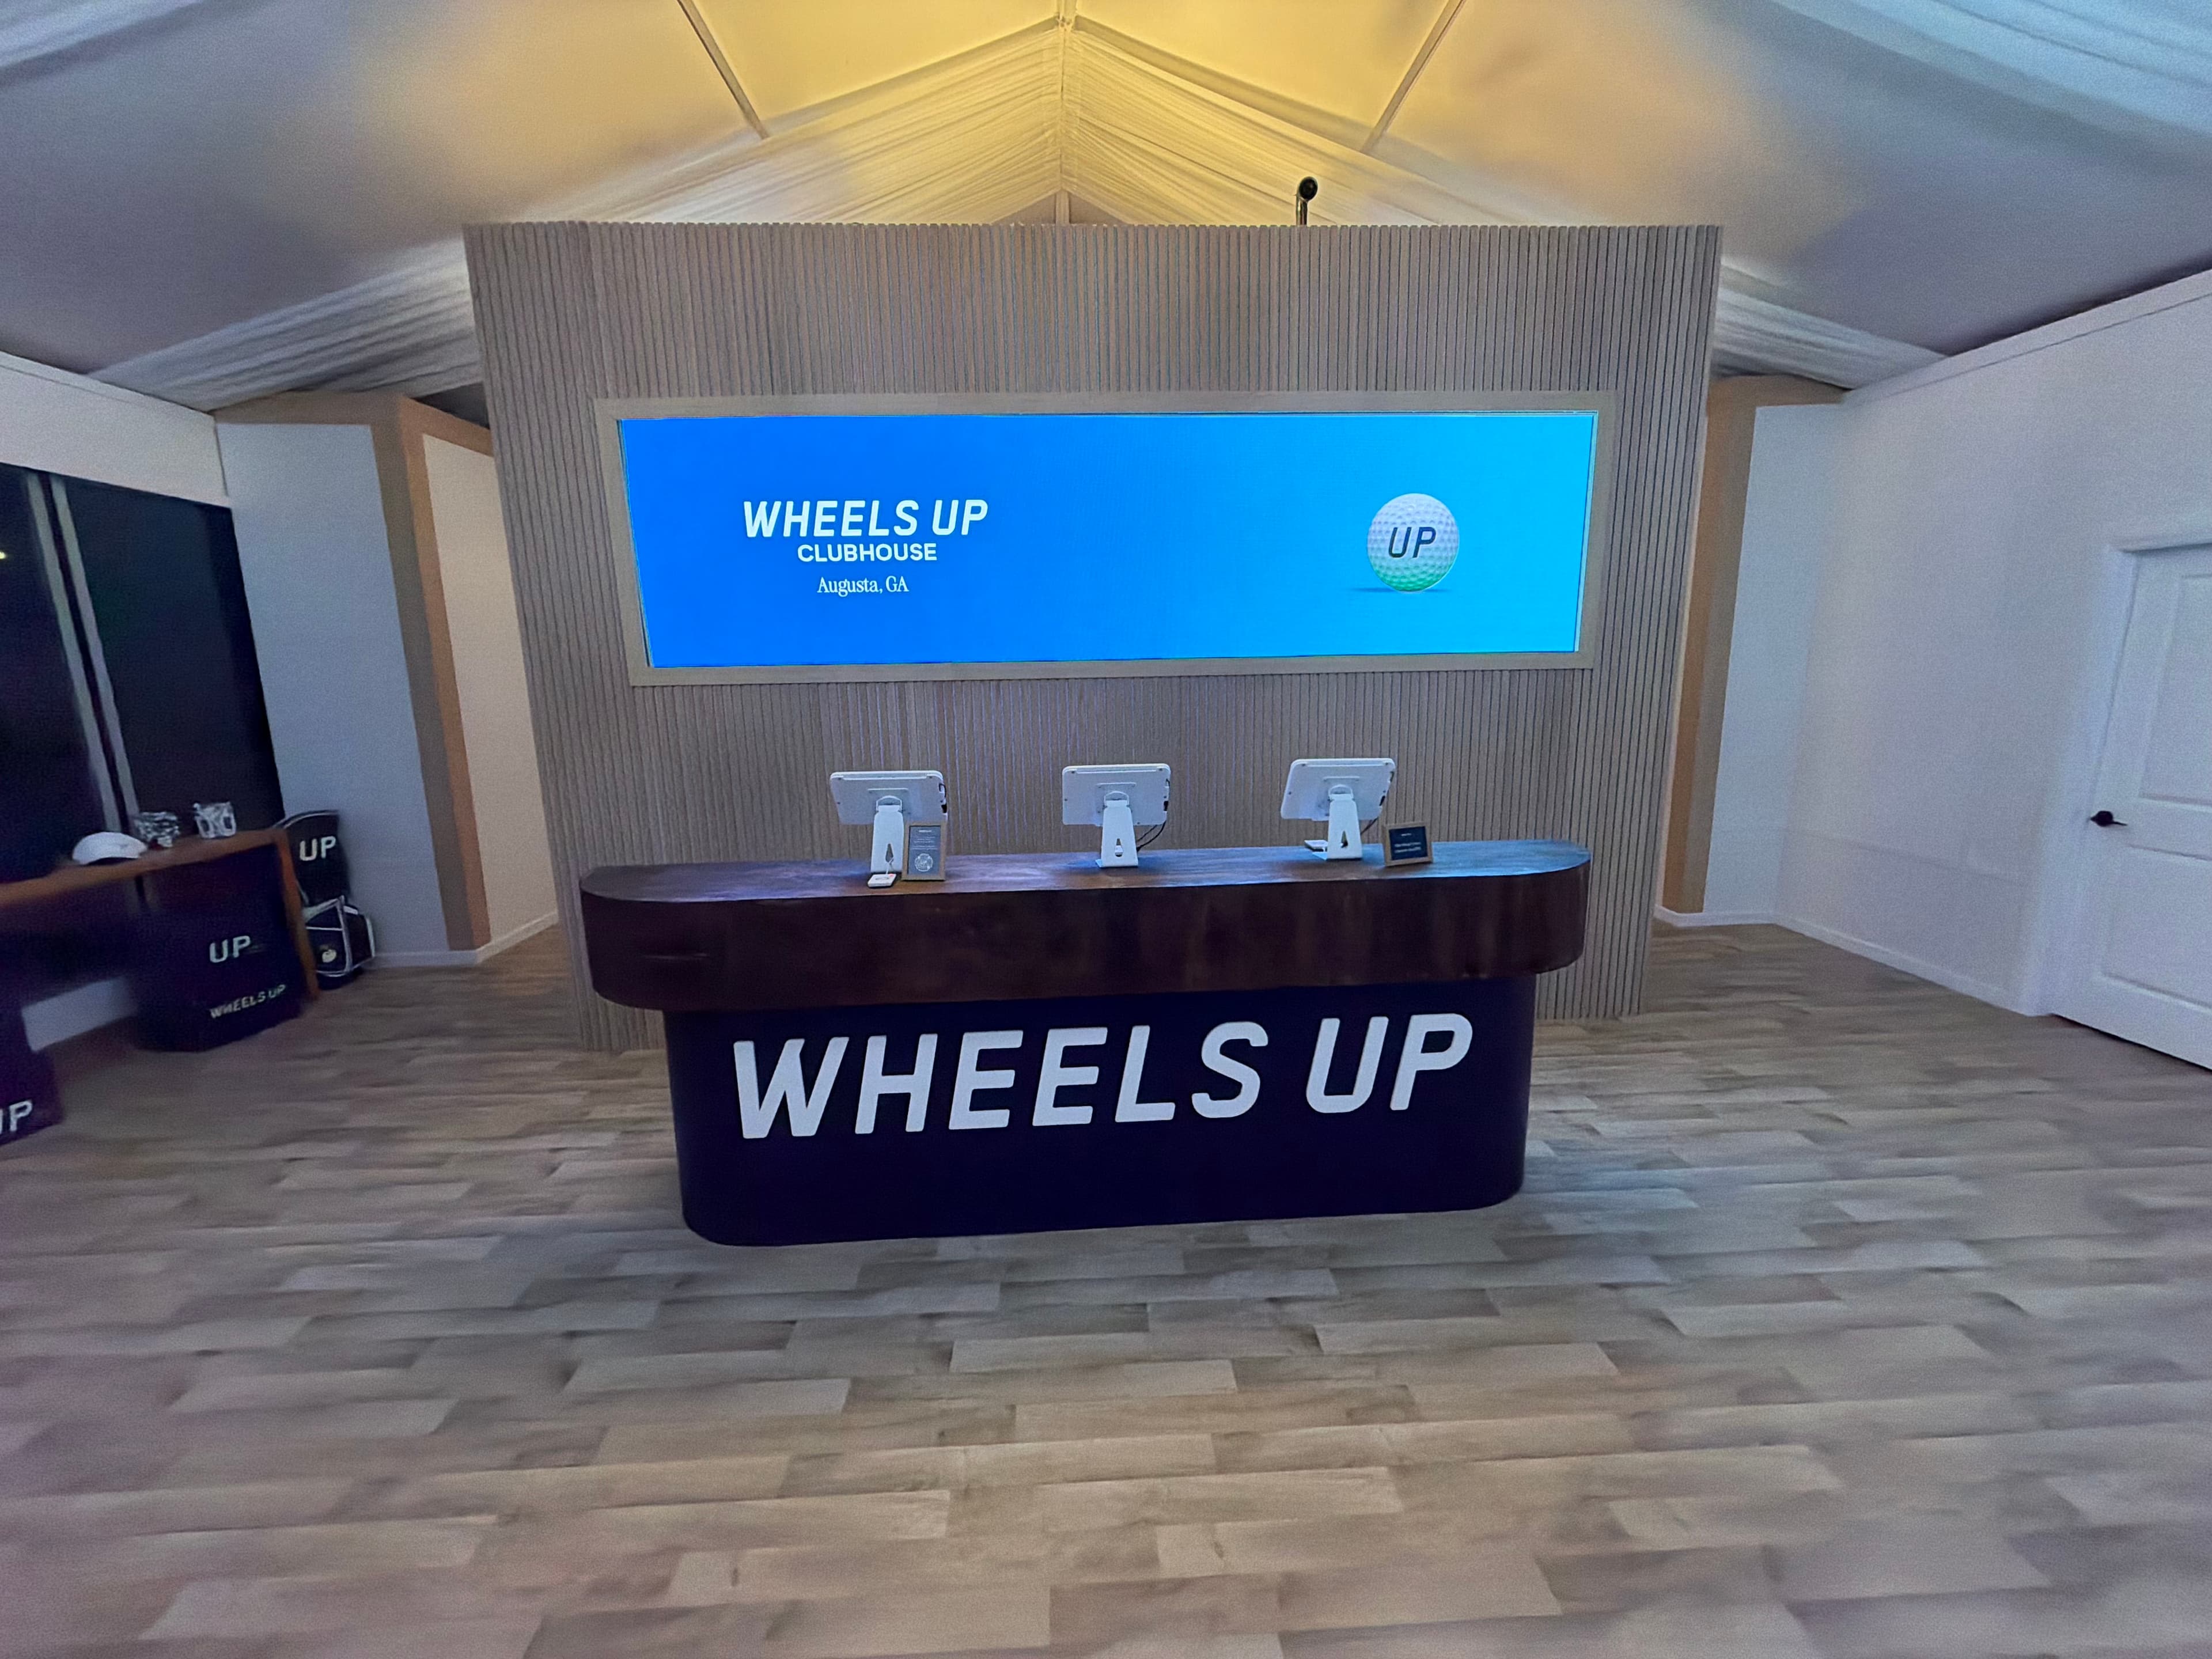
One deduped file, or a direct push to the client's platform, with every field above attached to the guest record. This is the difference between a report and proof: the client can act on it. At the Masters, the Wheels Up program tied RFID credentials to guest profiles so hospitality staff knew who was in the clubhouse in real time; the same data became the post-event list.
What is not in the report
- Vanity totals with no denominator. "3,000 photos" means nothing without "from 1,900 guests."
- Anything the guest did not consent to. If a field was not on the screen, it is not in the export.
- Personal data after close. PII is purged once the final export is delivered, unless the client asks for a retention period; aggregate counts stay in the dashboard.
If your current vendors hand you three exports, ask them for the seventh number. If they cannot produce it, that is the week you are paying for.